Description
Get familiar with mean, median, mode, and range, and how this can be used in daily life.
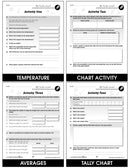
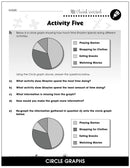
Our resource provides task and word problems surrounding real-life scenarios. Examine fundraising amounts by finding the mean, median and mode. Create a pictograph and make observations from the data. Express answers from a circle graph in ratios and percents. Show patterns in a set of data and make inferences from what you see. Label the coordinates on a graph. Calculate the probability of which hockey team will win the Stanley Cup based on the data given. Show your results on a graph. The task sheets provide a leveled approach to learning, starting with grade 6 and increasing in difficulty to grade 8. Aligned to your State Standards and meeting the concepts addressed by the NCTM standards, reproducible task sheets, drill sheets, review and answer key are included.


